|
1
|
- Helen Teague
- http://4oops.com
|
|
2
|
- Kidspiration is a program for grades k-5.
- This program visually helps students learn to think, write and
comprehend a variety of information.
- Graphic organizers can be used to combine pictures, texts and spoken
words.
- Younger students can develop literacy skills at an earlier age.
- Older students can improve their comprehension skills and learn how to
organize their writing in a more efficient way.
- There is an audio feature in Kidspiration, too.
|
|
3
|
- Visual learning is being to be one of the “best methods for teaching”
(Inspiration.com) because it allows teachers to “teach students to
clarify their thinking skills, organize, and prioritize new information”
(Inspiration.com).
- Using graphic organizers makes “information easier to understand and
learn” (Hyerle, 2000).
- For students with disabilities, writing often “provides even greater
frustration” (James, et.al., 2001) in the classroom because many
factors, such as “poor spelling and handwriting skills and the inability
to organize the needed materials slow the rate of word production”
(2001).
|
|
4
|
- A study conducted by James, Abbott, and Greenwood, 2001 found that in
“children with special needs, findings suggested that a large part of
their gains could be attributed to the use of graphic organizers”
- Research on using computers and graphic organizers “found that
presenting selected graphic organizers on computers helps students to
see the relationships between main ideas and supporting details, and
this in turn leads to higher scores on reading and writing tests”
(Hyerle, 1996).
|
|
5
|
|
|
6
|
|
|
7
|
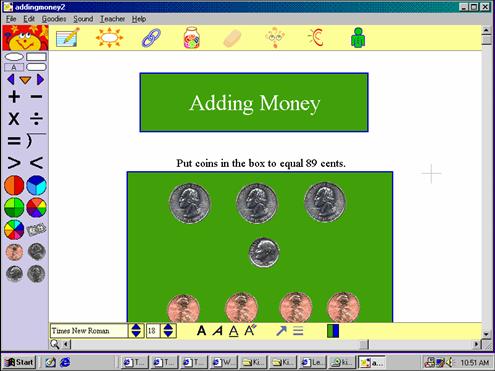
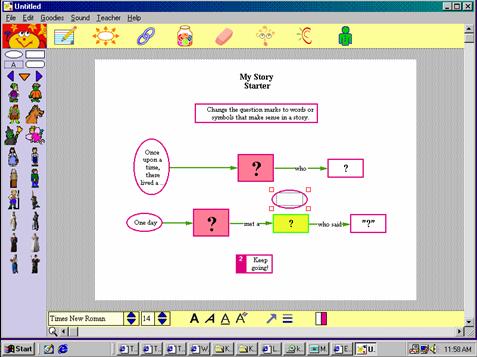
- Kidspiration comes with lots of built-in activities to help you and your
students get acquainted with visual learning.
- Start Kidspiration
- Point to and click an area under “Activities” to explore activities in
your curriculum area
- Close the activity to return to the Starter Screen
|
|
8
|
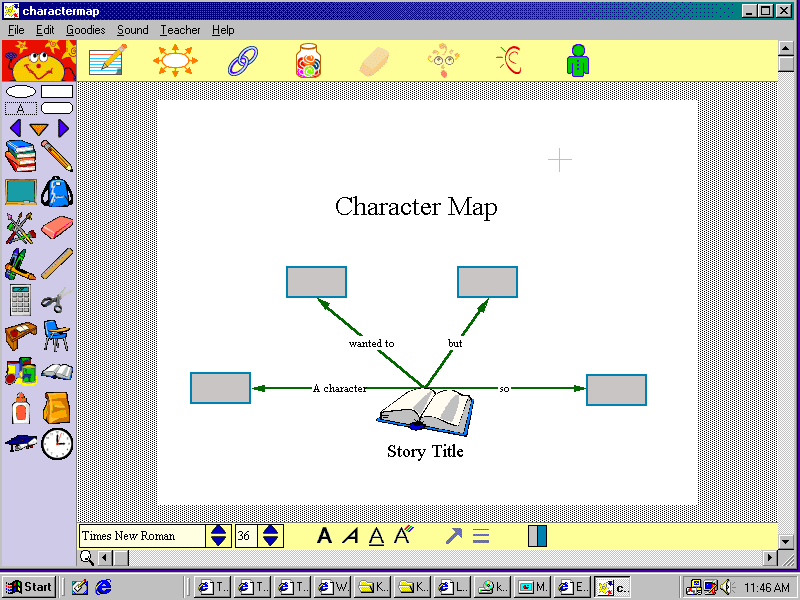
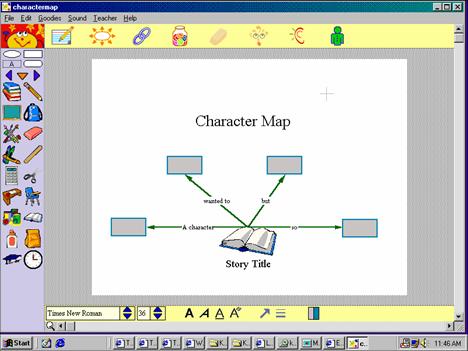
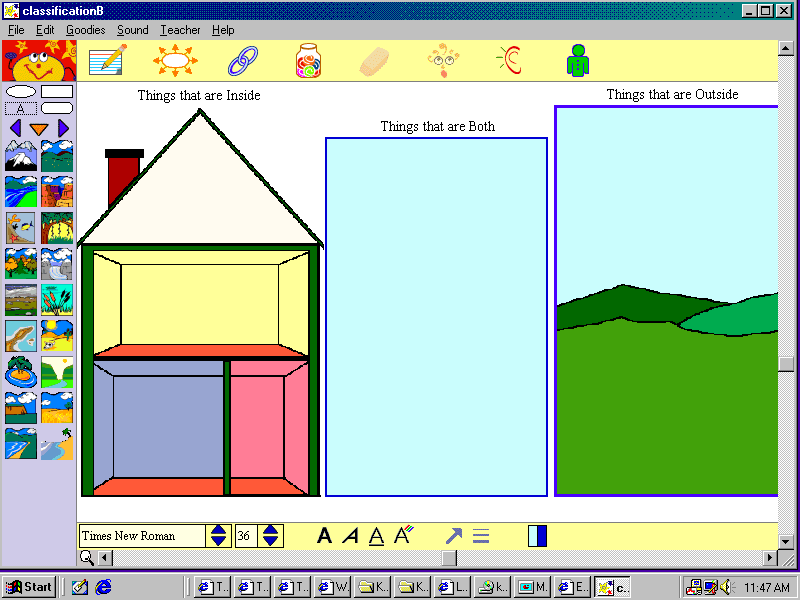
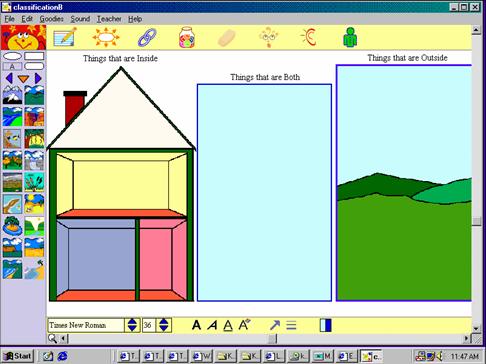
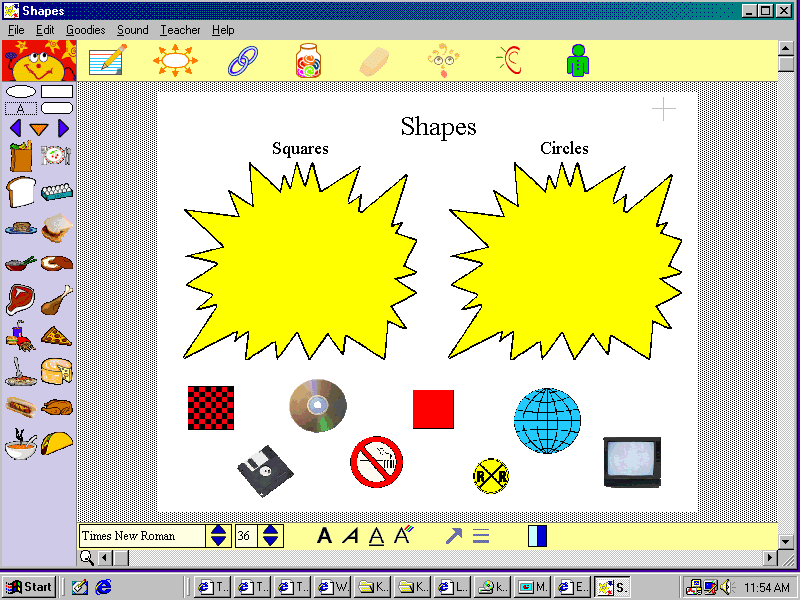
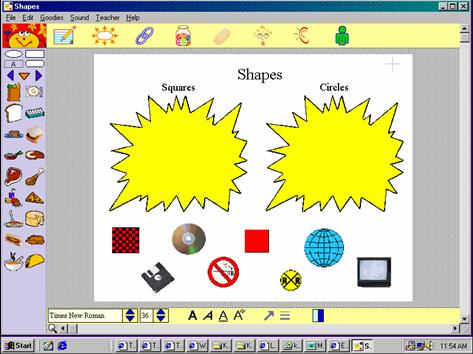
- Click “File” then “New” to create a new picture.
- Click “Picture” under “New”.
- Click the “SuperGrouper” button and choose a symbol.
- Type a heading for the picture. Click outside the picture.
- Click the “SuperGrouper” button again. Add another symbol with a
heading.
- Students can drag pictures from the picture pallette into your groups.
|
|
9
|
- Use your students’ input to brainstorm ideas (using a projector).
- Create a diagram with the class (using a projector) to introduce a new
concept.
- Create a diagram or “supergroups” to print and hand out to reinforce or
to introduce a new concept.
- Create a printed diagram students can color or complete.
- Have students create their own diagrams or complete supergroups.
- Create a diagram with parts missing which students fill in as a test.
|
|
10
|
|
|
11
|
|
|
12
|
|
|
13
|
|
|
14
|
|
|
15
|
|
|
16
|
|
|
17
|
|
|
18
|
|
|
19
|
|
|
20
|
|
|
21
|
|
|
22
|
|
|
23
|
|
|
24
|
|
|
25
|
- Click “Picture” under “New” on the Starter Screen to create a new
picture.
- Type Seasons.
- Click the “Add Symbol” button on the Toolbar 4 times to add 4 new
symbols.
- Click each symbol and type a season to add the four seasons.
|
|
26
|
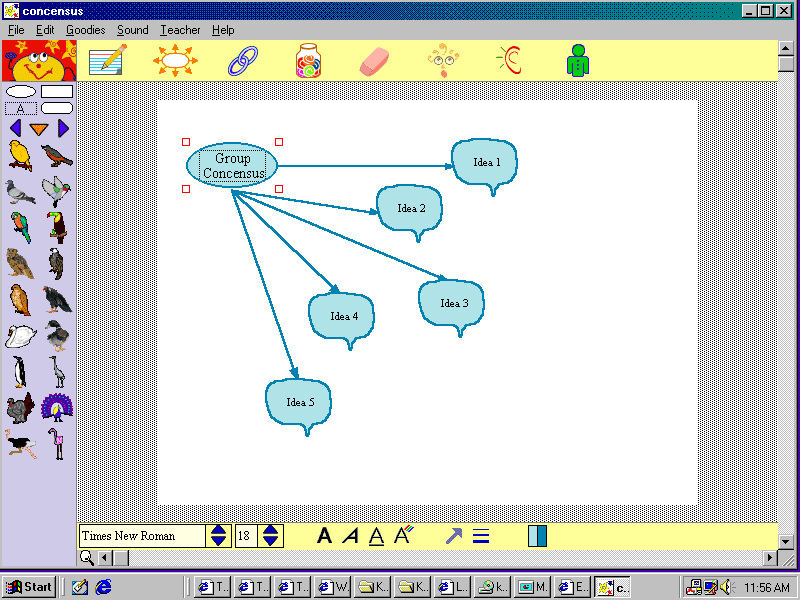
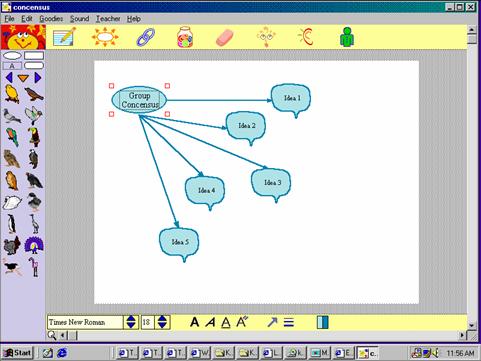
- Click on one of the season symbols.
- Click the “Add Symbol” button two times to add two symbols.
- Click on each new symbol and type something about that season.
- You can drag symbols to move them.
- You can use the “Link” tool to link symbols if needed. (Press the
“escape” key or click the Link” button again to drop it.)
|
|
27
|
- Click the “Pick Library” arrow on the picture palette. Click “Science”,
then click the right arrow for more science pictures.
- Click the symbol you want to change, then click the picture on the
palette.
- Or you can drag pictures from the palette into your diagram.
- You will probably have to move the symbols around to make room for the
graphics.
|
|
28
|
- You can change the size of the graphics by dragging the squares in each
corner of the graphic.
- You can change the colors of the graphics and text by using the buttons
on the drawing toolbar at the bottom of the diagram.
|
|
29
|
- Click on a symbol or graphic to add words.
- Click “Sound” on the Menu Bar, then “Record”.
- Click the “Record” button, speak into the microphone, then click “Stop”.
Click “Save” to save the sound.
|
|
30
|
- Click the “Go to Writing” button to switch to writing view.
- Students can type text under any topic or use the “Move Left” or “Move
Right” buttons to organize their thoughts.
- Use the “Prefix” button on the toolbar at the bottom of your screen to
create a numbered outline.
- Students can print their outlines by clicking on “File”, then “Print”.
- Click the “Go to Pictures” button to see your changes in your diagram.
|
|
31
|
- Click the “Student Name” button .
- Type your name in one of the boxes, and click “OK” to add your name to
the diagram.
- Your name will not show until you print the diagram.
|
|
32
|
- Click “File”, then “Save” to save your diagram. Be sure to indicate the
location on the “Save in” line as well as the file name.
- Click “Save”
|
|
33
|
|

 Notes
Notes